Query Optimization.
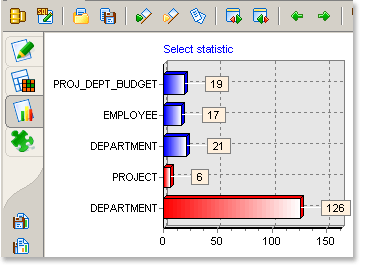
Query Analyzer is a right place to check your query speed and tune up it. After successful query execution you may check Execution Statistics page. For "select" statements please take a look at "select statistic" chart. It has one entry to each table used in your query. For each table it shows number of reads. Blue color means that server have used index for reading from this table. Red color means that table scan was used. If you have more than one red line you should attempt to rewrite your query or add indicies on fields used for joining or sorting.

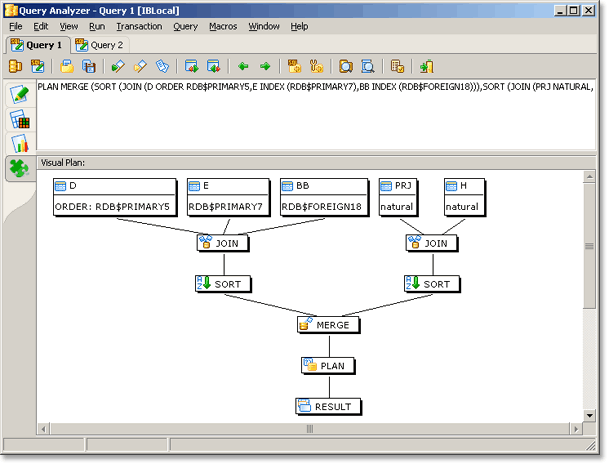
Query plan is also important thing to look into. To help you with understanding of the plan structure Query Analyzer provides "Visual Plan" feature:
